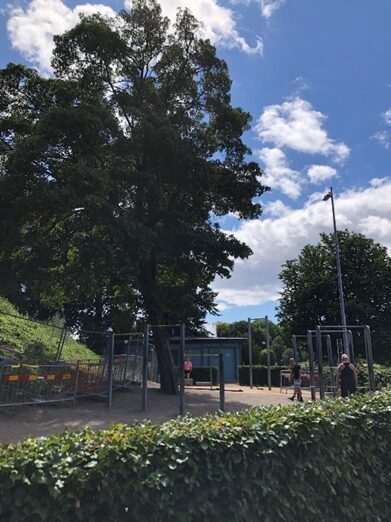
Are people physically active in Sweden? In my impression, many people are active here by taking a walk, biking to work, and working out at gyms. There is a park right beside my office in Malmö, and people are out for a walk after lunch. There is an even outdoor gym at the park.
According to the Global Observatory for Physical Activity and World Health Organization, around 65-67 % of people are physically active in Sweden (1,2). Being physically active means meeting the WHO’s recommended level of physical activity; 150 minutes of moderate-intensity physical activity per week. Physical activity is by the way defined as;
“Any bodily movement produced by skeletal muscles that requires energy expenditure. Physical activity refers to all movement including during leisure time, for transport to get to and from places, or as part of a person’s work.” (3)
In Sweden, physical activity level is tracked by the National Public Health Survey. The survey is conducted by The Public Health Agency of Sweden. It is called Health on Equal Terms survey (HLV) and it has been conducted since 2004 among 10,000-20,000 randomly sampled individuals aged 16-84 years (4). The survey questions specific to physical activity are:
“How much time do you spend in a normal week on physical training that leaves you out of breath – for example running, fitness training, or ball sports?”
“How much time do you spend in a normal week on daily activities – for example, walking, cycling, or gardening? Give the total time.”
Answers from: “0 minutes/no time”; “Less than 30 minutes”; “30-59 minutes (0.5-1 hour)”; “60-89 minutes (1-1.5 hours)”; “90-149 minutes (1.5-2.5 hours)”; “150-299 minutes (2.5-5 hours)”; “5 hours or more”.
The questions are shortened and modified versions of the International Physical Activity Questionnaire (IPAQ). IPAQ is the most commonly used questionnaire for physical activity (5). The above questions in HLV started being asked in 2016 and the trend of physical activity can be followed over time.
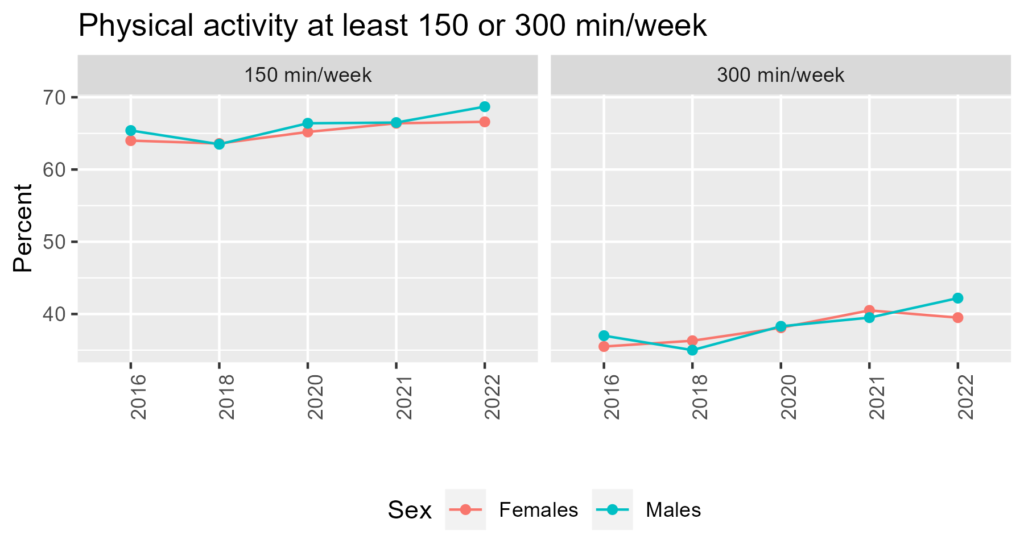
From the chart, the prevalence of physical activity seems to be increasing. Especially, those who engage in physical activity for more than 300 minutes per week increased almost by 5 %. Since 2019, more indoor and outdoor gyms have been built, and joining a gym seems to be a trend. In addition, since the COVID-19 pandemic in 2020, the government encouraged people to go outside and move to revert the negative consequence of longer time spent at home. Many people started “walking Fika” outside rather than in a café (Fika is the Swedish coffee break to feast on sweets and coffee while socializing with others) and hiking in nearby nature. One of the local families who I often spend time with mentioned; “I have never seen this many people in the forest in these past years!”.
Other questions kept track of the physical activity status of the population in Sweden. Those were also in HLV before 2016.
“How much physical movement and exertion have you had in the last 12 months? If your level of activity varies, e.g. between summer and winter, try to find an average. Please mark only one alternative!”
Answers from:
“Sedentary leisure time (You walk, cycle, or otherwise exercise less than 2 hours a week.)”; “Moderate exercise in leisure time (You walk, cycle, or otherwise exercise at least 2 hours a week, usually without sweating. Include in this walking to and from work, other walking, ordinary gardening, fishing, table tennis, bowling.)”; “Moderate, regular exercise in leisure time (You exercise regularly 1-2 times a week for at least 30 minutes each time, running, swimming, tennis, badminton, or other activity that makes you sweat.)”; “Regular exercise and training (You exercise by e.g. running, swimming, tennis, badminton, gymnastics, or similar on average at least 3 times a week. This lasts for at least 30 minutes each time.)”
and
“How much time do you spend in a normal week in moderately strenuous activities that make you warm? For example, walking fast, gardening, heavy housework, cycling, swimming. This may vary during the year but try to give some kind of average. Choose one alternative.”
Answers from: “5 hours or more a week”; “More than 3 hours a week and less than 5”; “Between 1 and 3 hours a week”; “No more than one hour a week”; “Not at all”.
The questions were not convertible to WHO’s recommended level of physical activity, but the trend from 2004 to 2015 can be followed.
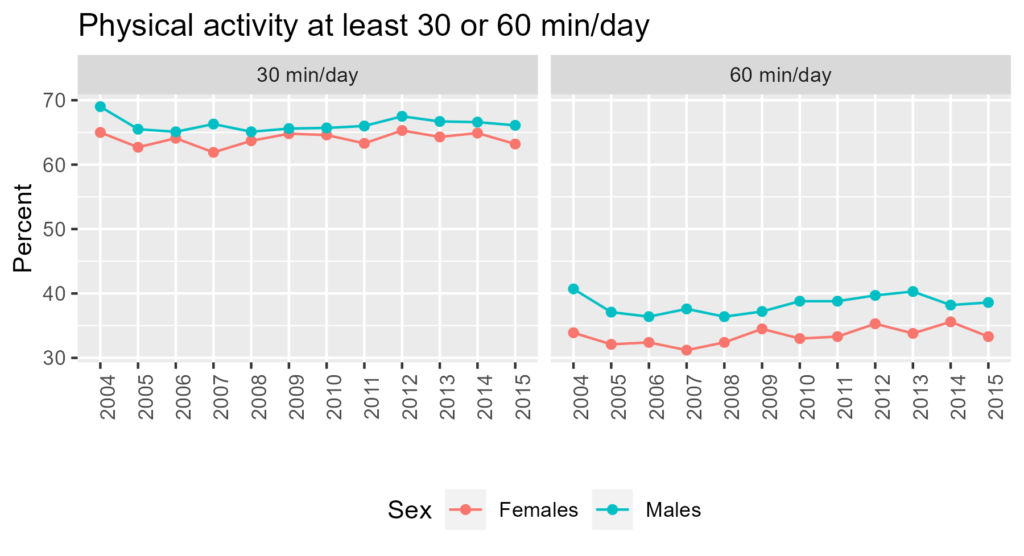
In contrast to the trend between 2016 and 2022, there is no obvious trend between 2004 and 2015. Still, there is a slight trend of increase if we focus on between 2005 and 2014. As 2004 was the initial year of the survey and 2015 was the transition year of the new survey method, there could be some bias in by smaller sample size.
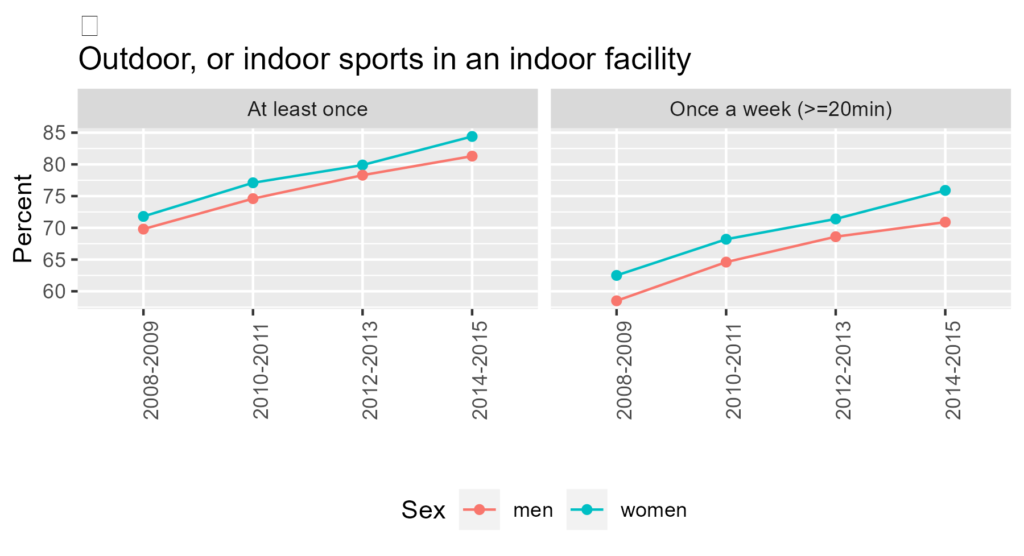
In addition to HLV, there is another national survey checking the physical activity status of the population. It is called the Survey of Income and Living Conditions (SILC). The survey is conducted by Statistics Sweden. SILC has been conducted since 1980 among 10,000 randomly sampled individuals aged 16-84 years. The detailed questions and answers of the survey are omitted here though, the chart below shows the trend of outdoor or indoor activity of the population.
There is another question in the SILC asking specifically the outdoor activity from 2008 to 2019. The question is:
“Have you during the last 12 months taken leisure walks in the forests and fields to experience nature, pick mushrooms or berries? How many times and how often (during the last 12 months)?”
(Pick mushrooms and berries?! That’s so Swedish. In Sweden, under the legislation, Right of Public Access, you can freely camp, pick mushrooms and berries, and roam in nature.)
Answers from: “Several times a week (more than 60 times)”; “A few times a week (21-60 times)”; “A few times a month (6-20 times)”; “A few times during the last three months or less often (1-5 times)”.
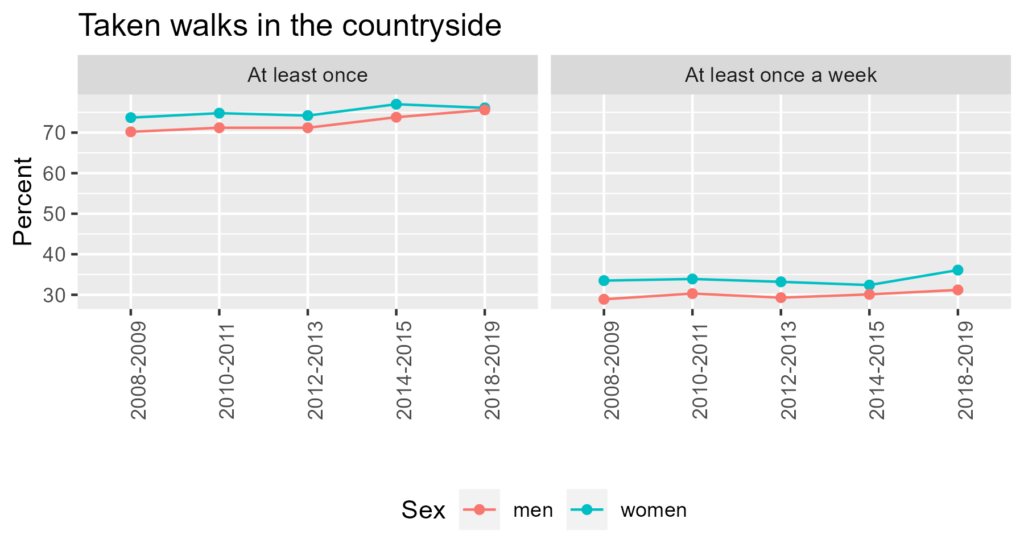
Although it is subtle, it seems increasing.
All these survey data are publicly available from the Public Health Agency of Sweden and Statistics Sweden (7,8). As aforementioned, SILC has been conducted since 1980 but the previous data before 2008 is not available on the website. There was a change of survey method from face-to-face to telephone interviews in 2008, and therefore, the data are not comparable anyway. One of the studies found that there was a gradual increase in physical activity from 1980 to 2005 as well (9). However, the study found that there was not much increase in physical activity in low education status people and asserted the concern of inequality.
That is an important caveat when looking at all the data above. Overall physical activity seems to be increasing in Sweden, which is great, but how is it if we look at it by gender, age groups, regions, immigrants/natives, and socioeconomic status (income, education, and employment)? The increase could have been only among people with high socioeconomic status. Many initiatives aiming to improve the physical activity of the population are ongoing such as building better bike paths, outdoor gyms, and improving access to public transport. It is important to see who is benefiting from those initiatives.
References
- World Health Organization. Sweden Physical Activity Factsheet 2021. World Health Organization Regional Office for Europe; 2021.
- Global Observatory for Physical Activity. Country Cards [Internet]. 2020 [cited 2023 Jul 18]. Available from: https://new.globalphysicalactivityobservatory.com/card/?country=SE
- World Health Organization. Physical activity [Internet]. World Health Organization; 2022 [cited 2023 May 16]. Available from: https://www.who.int/news-room/fact-sheets/detail/physical-activity
- Folkhälsomyndigheten. Nationella folkhälsoenkäten – Hälsa på lika villkor [Internet]. 2023 [cited 2023 Jul 19]. Available from: https://www.folkhalsomyndigheten.se/folkhalsorapportering-statistik/om-vara-datainsamlingar/nationella-folkhalsoenkaten/
- IPAQ. IPAQ [Internet]. 2022 [cited 2023 Jul 19]. Available from: https://sites.google.com/view/ipaq/home
- Folkhälsomyndigheten. Folkhälsodata. 2023 [cited 2023 Jul 18]. Physical activity (self-reported) by age, sex and year. Percentage. Available from: http://fohm-app.folkhalsomyndigheten.se/FolkhalsodataFolkhalsodata/pxweb/en/A_Folkhalsodata/A_Folkhalsodata__B_HLV__aLevvanor__aadLevvanorfysak/hlv1fysaald.px/
- Statistics Sweden. Statistics on Income and Living Conditions [Internet]. Statistics Sweden; 2022 Oct [cited 2023 Apr 12]. Available from: https://www.scb.se/en/finding-statistics/statistics-by-subject-area/living-conditions/living-conditions/living-conditions-surveys-ulfsilc/#_Moreinformation
- Folkhälsomyndigheten. Statistical database [Internet]. 2023 [cited 2023 Jul 18]. Available from: http://fohm-app.folkhalsomyndigheten.se/Folkhalsodata/pxweb/en/A_Folkhalsodata/A_Folkhalsodata/
- Leijon M, Midlöv P, Sundquist J, Sundquist K, Johansson SE. The longitudinal age and birth cohort trends of regular exercise among adults aged 16–63 years in Sweden: a 24-year follow-up study. Popul Health Metr. 2015 Jul 29;13(1):18.