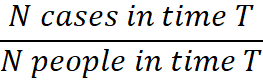
Measuring the occurrence of diseases is another central feature of epidemiology [1]. The term “risk” is often used because it is interpretable. Risk is principally interpreted as the probability that takes a value from 0 to 1 (or 0 to 100%). For example, we may see a news headline that states “the risk of 40 years old men developing a heart attack is 5%”. The statement is intuitive, especially when there is a comparative statement, for instance, “the risk of 40 years old men developing low back pain is 20%”. One can interpret that the incidence of low back pain is more common than a heart attack among 40 years old men. However, both statements are not perfectly interpretable unless time is specified. Is 5% the lifetime risk (until they die) for men to develop a heart attack or during the 40s (10 years risk)? The risk 5% would mean different depending on the specified time. In epidemiology, the risk is calculated as follows:
For example, if the risk 5% of a heart attack was lifetime, that would have been calculated as:
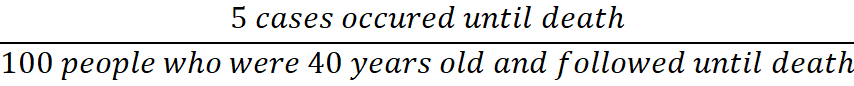
This is called “incidence proportion”, and the denominator indicates that all 100 people were followed until death (i.e., specified time), and that is the necessary condition to get an unbiased estimate for the risk. If half of 100 people were not followed until death for any reason, e.g., moved somewhere, declined to participate in the study, the risk would be underestimated. The underestimation would occur because there would have been some cases of heart attack among half of the 100 people who were lost to follow-up. Although the incidence proportion is intuitive and interpretable as risk, the underestimation almost always occurs because not all people are followed during the specified time period in most situations.
To overcome this, “incidence rate” is most often used in epidemiology. Incident rate is calculated as:
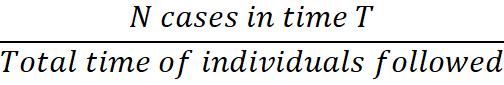
The denominator is now “time” instead of the number of individuals. For example, if there were 5 cases of heart attack during 10 years of follow up for 100 men who were 40 years old, incidence rate would be:
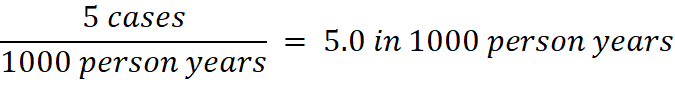
Incidence rate is not as intuitively interpretable as incidence proportion. It takes a value from 0 to infinity, and it refers to an instantaneous rate rather than probability. To interpret incidence rate, one wants to know incidence rate of the same disease in other populations, or incidence rate of other diseases. For example, if there were 2 cases of heart attack during 10 years of follow up for 100 women who were 40 years old, the incidence rate would be 2.0 in 1000 person-years. One could then interpret that the incidence of heart attack is less common among 40 years old women than men. In a more intuitive sentence, one could state that men may be at a higher risk of heart attack than women, although the use of the term “risk” is not perfectly correct. One should be careful not to mix risk (incidence proportion) and rate (incidence rate), as they are inherently different. An advantage of incidence rate is that one can avoid underestimating the rate, as the denominator accounts for time of follow-up for each individual. For example if, among 100 men who were 40 years old, 20 of them were followed for 10 years, 40 of them were followed for 5 years, and the rest of 40 of them were followed for only 2 years, and there were 5 cases of heart attacks, the incidence rate would be:

Different follow up time for people were accounted in the denominator, and that resulted in the incidence rate of 17.85 in 1000 person years, which is much higher than 5.0 in 1000 person years when all 100 people were followed up for 10 years. To learn more about incidence rate, one can read the nice and comprehensive instructions of survival analysis [2].
References
1. Rothman KJ. Epidemiology: An Introduction. New York, NY: Oxford University Press; 2012.
2. Kleinbaum DG, Klein M. Survival Analysis: A Self-Learning Text [Internet]. New York, NY: Springer; 2012 [cited 2025 May 15]. (Statistics for Biology and Health). Available from: http://link.springer.com/10.1007/978-1-4419-6646-9