Performing well at school is important for children’s future well-being. That can be measured by standardized tests or school grades, and “academic performance” is a decisive factor for children to attain further education and integrate into the labor market. Subsequently, that leads to their good physical, mental, and social well-being. However, there is a great gap in academic performance among students. Low-performing students often have disadvantaged backgrounds, such as poor socioeconomic status (e.g., low parental income or education) or being immigrants. The gap ascribed to inequity in education is simply unjust as everybody should be entitled to equal opportunities to learn, develop, and perform.
The gap in academic performance has been examined by the Organization for Economic Corporation and Development (OECD). OECD initiated the Programme for International Student Assessment (PISA) in 2000 which assesses the knowledge and skills in reading, mathematics, and science of 15-year-old students. PISA takes place every three years in OECD countries and the trend of academic performance can be assessed for each country (1).
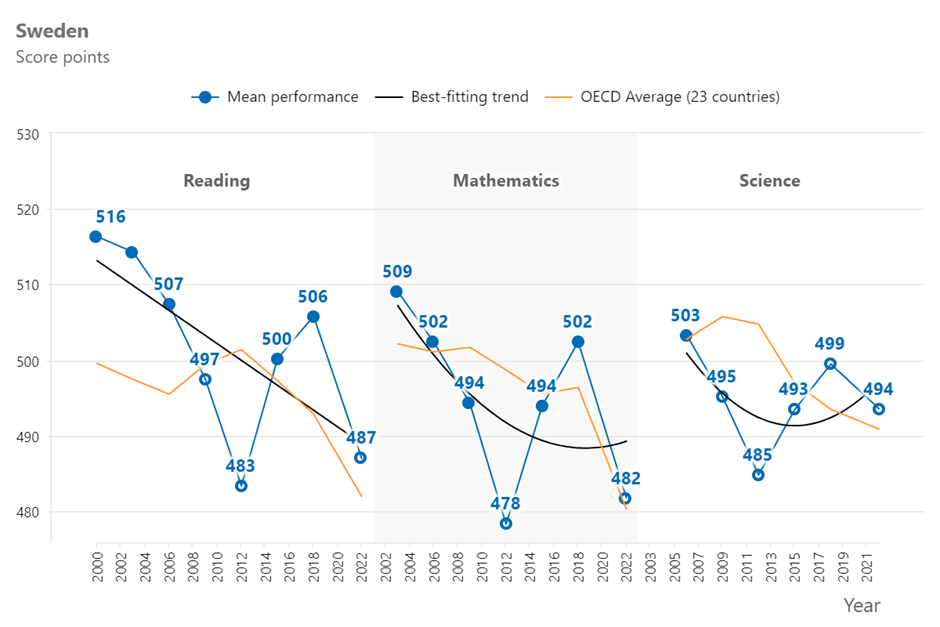
Sweden used to be one of the top countries with high academic performance and equity among the participating countries for PISA. However, their performance declined significantly in 2012. Although it increased in 2015 and 2018, it dropped again in 2022 to the same level as 2012 (Figure 1) (2).
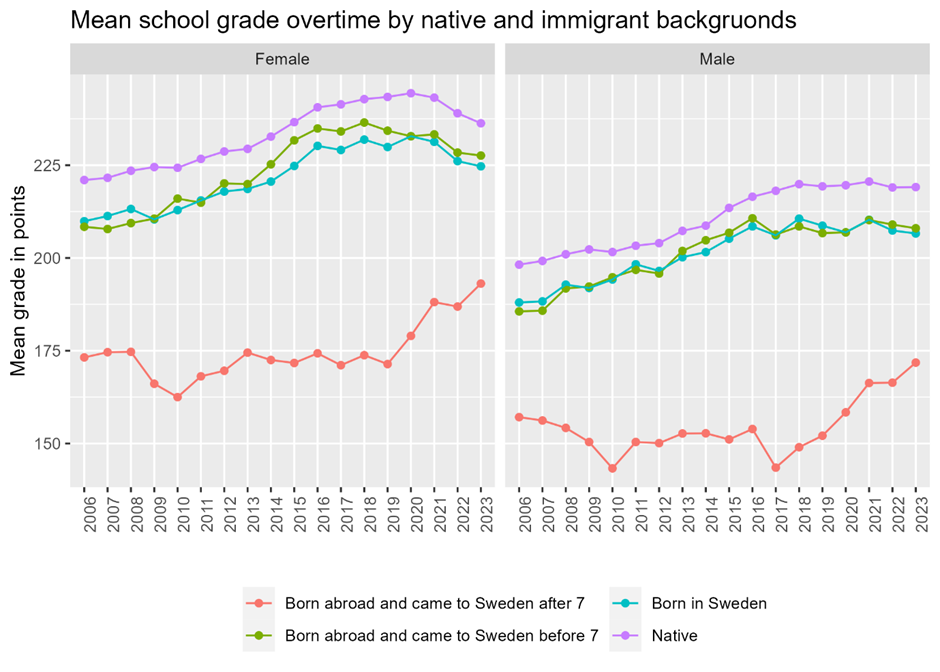
What is more concerning is that the gap between high- and low-performing students has persisted over time (3–5). Several research identified the consistent gap between native and immigrant students over time in PISA, national standardized exams, and school grades (6,7). The gap is kept track by the National Agency of Education (Skolverket) (8). Figure 2 shows the mean school grades of ninth year’s students over time by native and immigrant backgrounds based on the open data from the National Agency of Education (9). The ninth year is the final year of compulsory education in Sweden and the grade is important for students to get admitted to upper secondary schools. We can see that native students are performing constantly better than students with immigrant backgrounds.
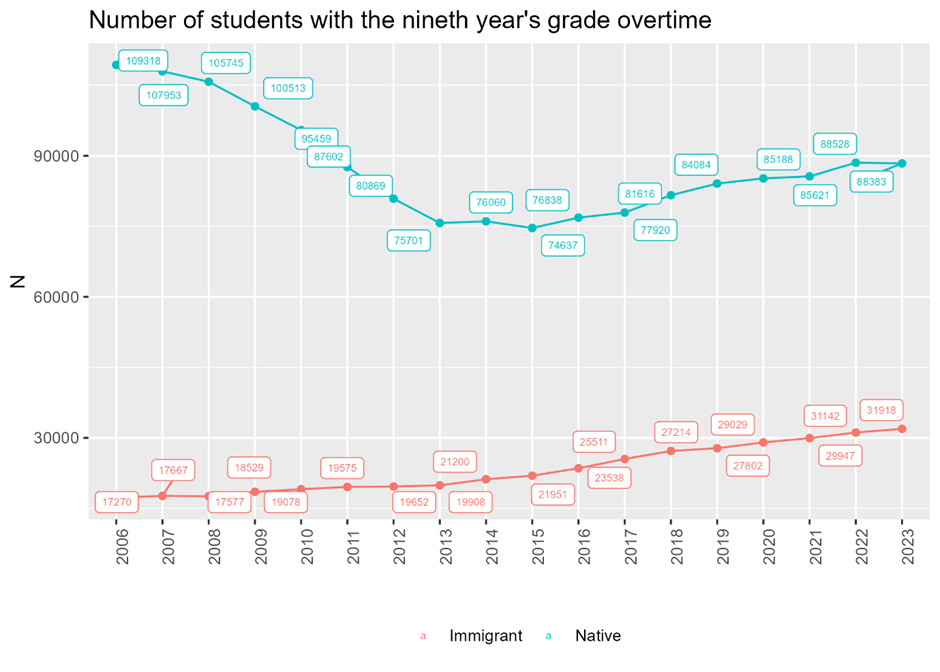
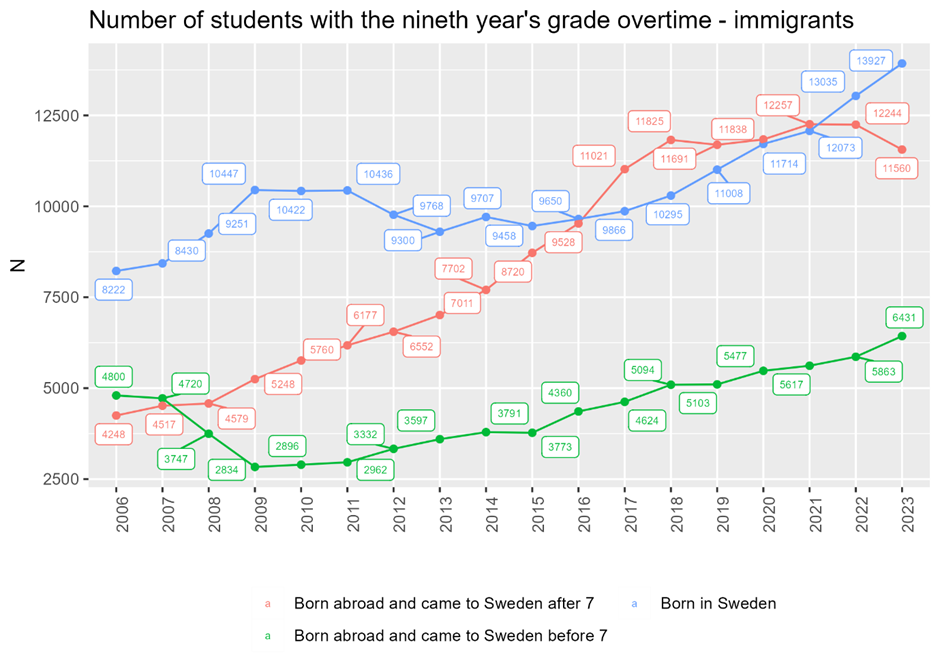
The number of students with immigrant backgrounds has been increasing (Figure 3, 4). This is due to the increased number of immigrations over the past decades (Find more in Immigration in Sweden I). Even though immigration to Sweden has been restricted since 2016, the large share of students with immigrant backgrounds would persist by children of immigrants (born in Sweden and whose parents are foreign-born).
Given this continuous increase in the share of students with immigrant backgrounds, ensuring their academic performance is crucial. There are numerous measures undertaken in Sweden to support students with immigrant backgrounds. However, evidence-based intervention is lacking and the gap is not closing. More research is needed to propose effective strategies to reduce the gap.
References
1. OECD. OECD. 2023 [cited 2024 Feb 7]. PISA 2022 results: Preparing students for a changing world. Available from: https://www.oecd.org/publication/pisa-2022-results/
2. OECD. OECD. 2023 [cited 2024 Jan 29]. Sweden, Factsheets, OECD PISA 2022 results. Available from: https://www.oecd.org/publication/pisa-2022-results/country-notes/sweden-de351d24/
3. Rolfe V. Exploring socioeconomic inequality in educational opportunity and outcomes in Sweden and beyond [Internet]. University of Gothenburg; 2021 [cited 2024 Jan 24]. Available from: https://gupea.ub.gu.se/handle/2077/68166
4. Henrekson M, Jävervall S. Educational performance in Swedish schools is plummeting. R Swed Acad Eng Sci. 2017;
5. Henrekson M, Wennström J. Educational Performance in Swedish Schools—What Are the Facts? In: Henrekson M, Wennström J, editors. Dumbing Down: The Crisis of Quality and Equity in a Once-Great School System—and How to Reverse the Trend [Internet]. Cham: Springer International Publishing; 2022 [cited 2024 Jan 29]. p. 23–61. Available from: https://doi.org/10.1007/978-3-030-93429-3_3
6. Lundahl L, Lindblad M. Immigrant Student Achievement and Education Policy in Sweden. In: Volante L, Klinger D, Bilgili O, editors. Immigrant Student Achievement and Education Policy: Cross-Cultural Approaches [Internet]. Cham: Springer International Publishing; 2018 [cited 2024 Jan 29]. p. 69–85. (Policy Implications of Research in Education). Available from: https://doi.org/10.1007/978-3-319-74063-8_5
7. Grönqvist H, Niknami S. The performance gap between native and foreign-born pupils. SNS Rep Rep Summ [Internet]. 2020; Available from: https://www.sns.se/en/articles/increased-performance-gap-between-native-and-foreign-born-pupils/
8. Skolverket. Slutbetyg i grundskolan – våren 2023 [Internet]. 2023 [cited 2024 Feb 1]. Available from: https://www.skolverket.se/publikationsserier/beskrivande-statistik/2023/slutbetyg-i-grundskolan—varen-2023
9. Skolverket. Statistik [Internet]. 2024 [cited 2024 Feb 7]. Available from: https://www.skolverket.se/skolutveckling/statistik