In Sweden, more than 50 % of adults are overweight or obese (1). Overweight is when body mass index (BMI) is between 25 and 29.9 and obesity is when BMI is over 30. In the state of overweight or obesity, the risk of developing chronic diseases increases, such as type 2 diabetes and heart disease. Among 50 % of overweight people, around 15 % were obese. The Public Health Agency of Sweden keeps track of obesity prevalence through the National Public Health Survey – Health on Equal Terms (HLV) since 2004. The survey is conducted among 10,000-20,000 randomly sampled individuals aged 16-84 years from the population every year. BMI is calculated based on the self-reported height and weight of the survey respondents. Therefore, the trend of obesity prevalence can be followed from 2004 (2).
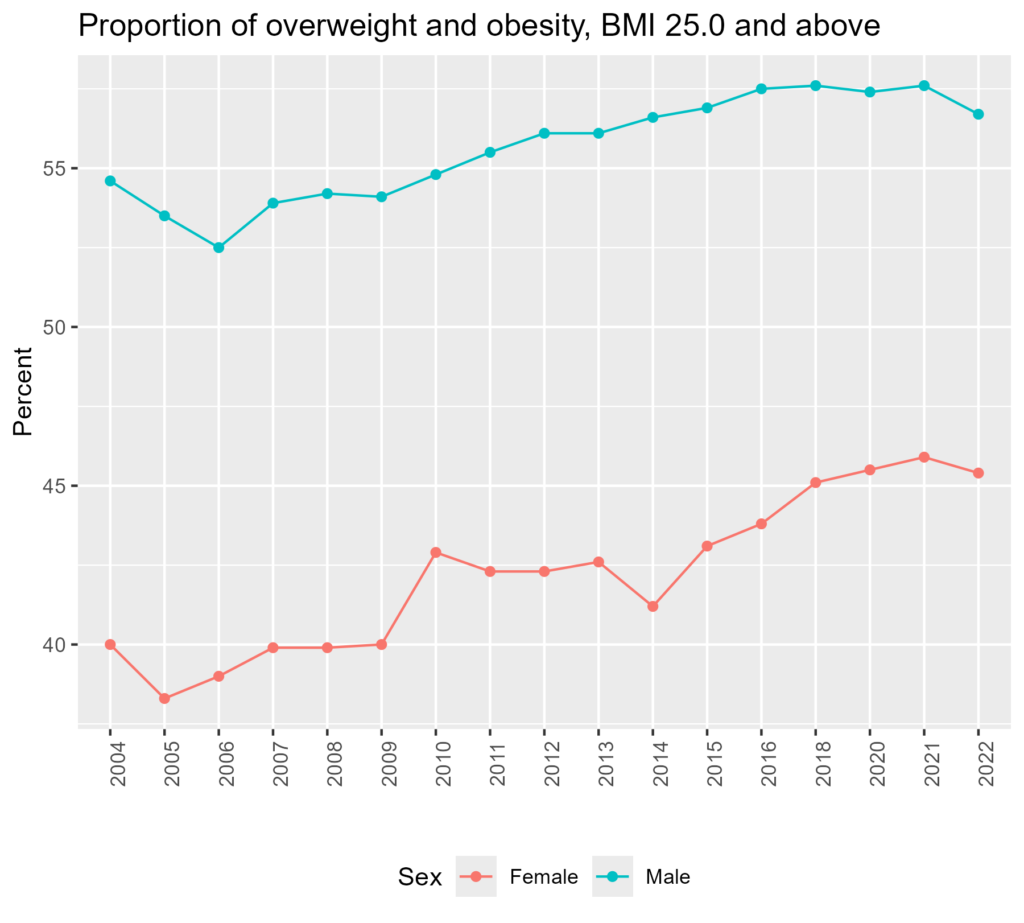
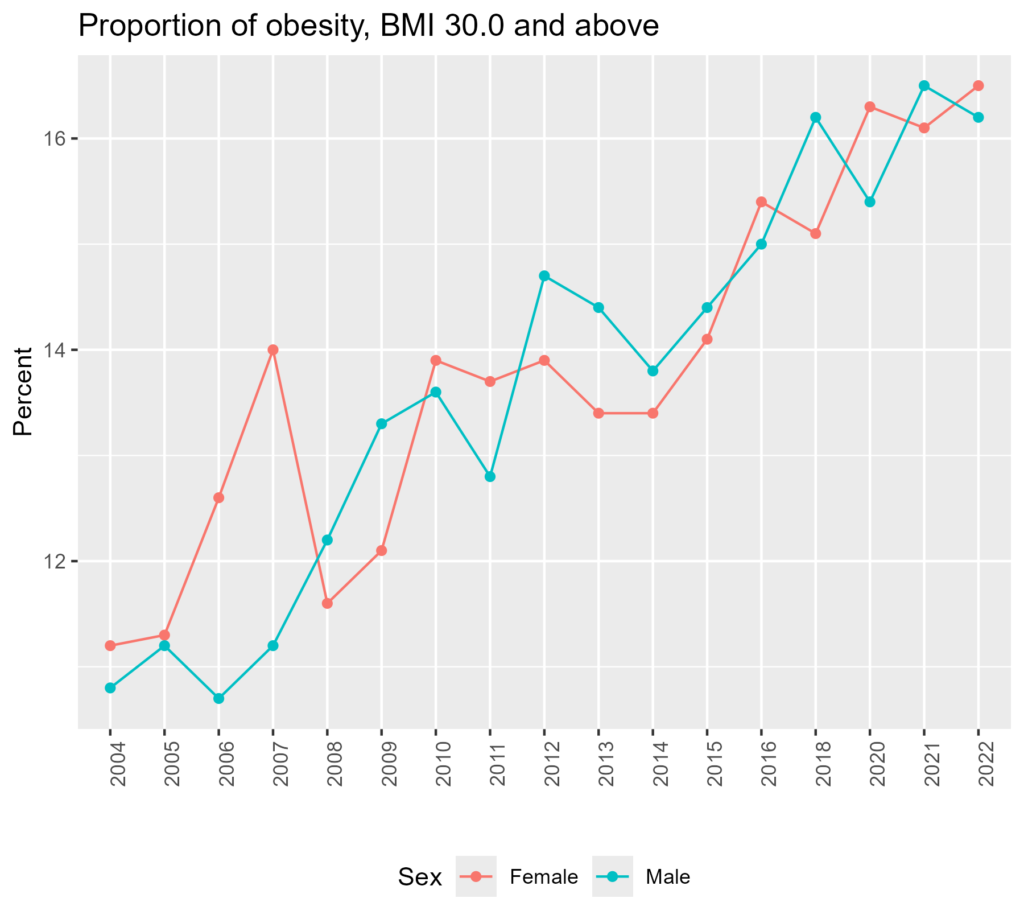
From the chart, both overweight and obesity seem to be increasing. It is, unfortunately, a global trend. Due to industrialization, modernization, urbanization, and globalization, our lifestyles changed dramatically. We started driving instead of walking or bicycling, we started eating fast food instead of the traditional diet. These are only among a few of the changes that drove our energy expenditure low and energy intake high. As a result, in almost all parts of the world, the prevalence of overweight and obesity is increasing. Sweden seems not to be the exception. This phenomenon; with high prevalence and increasing trend is often referred to as the “Obesity epidemic”.
The prevalence and trend can be different across age groups.
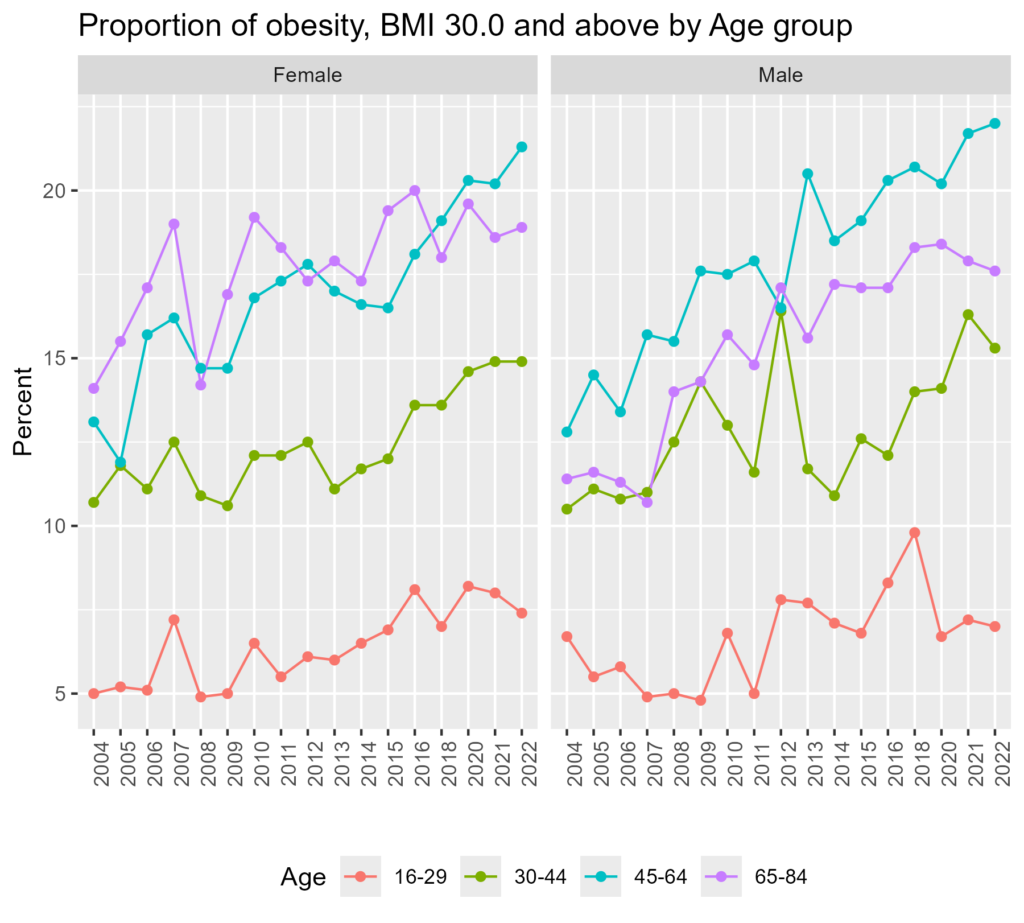
The chart above shows the prevalence trend of obesity (BMI>=30) by different age groups. Middle-old age groups have a more prominent trend of increase as well as higher prevalence than younger age groups. This does not imply though, we need to act on only older age groups. What we eat or do at an early age matters a lot in later life. Childhood obesity is an emerging problem in Sweden. Around 18 % of children aged 6-9 years are overweight or obese (4).
Another stark concern is that there is a gradient across socioeconomic status.
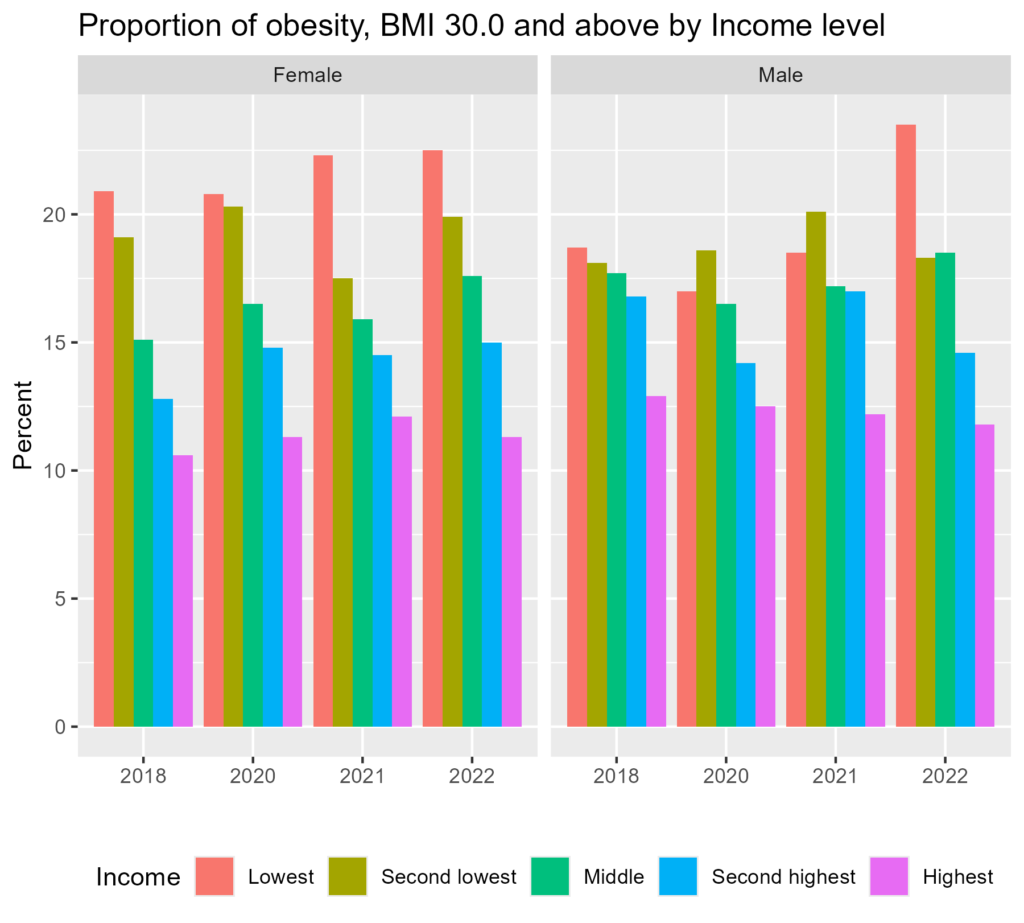
The above chart shows the prevalence and trend of obesity (BMI>=30) by five income groups. There is a gradient in every year. The lower the income, the higher the obesity prevalence. What is concerning more is that the increase in obesity is more prominent in the lowest income group. This is something applicable to numerous diseases and even mortality on a global scale. Socially disadvantaged people are taking a toll.
When looking at this by education level, there is a gradient every year.
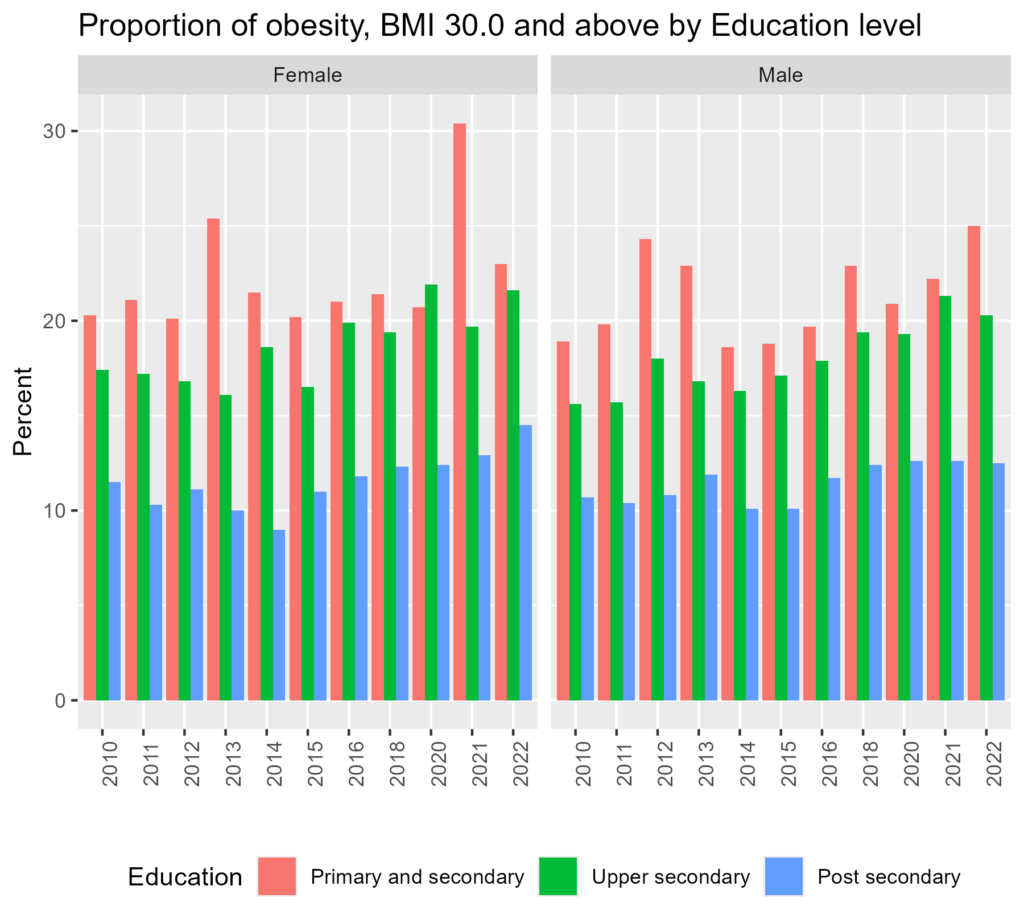
The chart shows the prevalence and trend of obesity (BMI>=30) by three education levels. There is a gradient in every year just like income groups. The lower the education, the higher the obesity prevalence. In contrast to the chart by income groups, the prevalence of obesity seems to be increasing at all educational levels. Needless to say, it is not good even though the gap seems not to be widening.
To countermeasure the obesity epidemic, many political and environmental interventions are going on in Sweden. For example, labeling the green keyhole for healthy food products by the Swedish Food Agency (7), and building better bike paths and public transport to promote people’s active travel by the Swedish Transport administration, municipalities, and regions (8). These interventions could encourage people to eat healthier and become more active. However, in-depth analysis may be necessary to see whom we should target in what way through the collaboration between researchers, policymakers, and practitioners.
References
- Folkhälsomyndigheten. Obesity – The Public Health Agency of Sweden [Internet]. 2018 [cited 2023 Jul 19]. Available from: https://www.folkhalsomyndigheten.se/the-public-health-agency-of-sweden/living-conditions-and-lifestyle/obesity/
- Folkhälsomyndigheten. Statistical database [Internet]. 2023 [cited 2023 Jul 18]. Available from: http://fohm-app.folkhalsomyndigheten.se/Folkhalsodata/pxweb/en/A_Folkhalsodata/A_Folkhalsodata/
- Folkhälsodata. [cited 2024 May 26]. Weight, BMI (self-reported) by age, sex and year. Percentage. Available from: http://fohm-app.folkhalsomyndigheten.se/FolkhalsodataFolkhalsodata/pxweb/en/A_Folkhalsodata/A_Folkhalsodata__B_HLV__bFyshals__bbeFyshalsvikt/hlv1bmiaald.px/
- Folkhälsomyndigheten. The prevalence of overweight and obesity among children is high and increases with age [Internet]. 2019 [cited 2023 Jul 20]. Available from: https://www.folkhalsomyndigheten.se/contentassets/0f9834a0584d40238461411bcf48f8a7/prevalence-overweight-obesity-children-high-increases-age.pdf
- Folkhälsomyndigheten. Folkhälsodata. [cited 2024 May 26]. Weight, BMI (self-reported) by financial situation, sex and year. Percentage. Available from: http://fohm-app.folkhalsomyndigheten.se/FolkhalsodataFolkhalsodata/pxweb/en/A_Folkhalsodata/A_Folkhalsodata__B_HLV__bFyshals__bbeFyshalsvikt/hlv1bmibeko.px/
- Folkhälsomyndigheten. Folkhälsodata. [cited 2024 May 26]. Weight, BMI (self-reported) by level of education, sex and year. Percentage. Available from: http://fohm-app.folkhalsomyndigheten.se/FolkhalsodataFolkhalsodata/pxweb/en/A_Folkhalsodata/A_Folkhalsodata__B_HLV__bFyshals__bbeFyshalsvikt/hlv1bmifutb.px/
- Livsmedelsverket. The Keyhole [Internet]. 2022 [cited 2023 Jul 20]. Available from: https://www.livsmedelsverket.se/en/food-and-content/labelling/nyckelhalet
- Trafikverket. Trafikverket. trafikverket@trafikverket.se; 2022 [cited 2023 Jul 20]. Direction framework for 2022–2033 and 2022–2036. Available from: https://bransch.trafikverket.se/en/startpage/planning/long-term-infrastructure-planning/direction-framework-for-20222033-and-20222036/
